|
|
|
 |
|
|
Biological Soil Crusts (BSC): Soebatsfontein
Introduction |
Biological Soil Crusts (BSC) occur in all biomes along the BIOTA-South transect except for the Fynbos. They can be classified into different types depending on the developmental time and the organism composition: three developmental stages of cyanobacterial crusts, mostly associated with green algae (ranging from initial to well developed crusts), lichen crusts (differentiated in cyanolichen and green algal lichen crusts), bryophyte and liverworth crusts, and the hypolithic crust type (community of photosynthetic organisms existing on sides and underneath translucent stones, e.g. quartz) occurring specifically in quartz gravel pavements (e.g. Knersvlakte - observatories Flaminkvlakte and Luiperskop, Namib Desert - observatory Wlotzkasbaken) but also underneath single quartz rocks of different sizes in other regions and biomes (e.g. observatory Ovitoto). Driving forces of such spatial variability of BSC types are climatic, topographic, pedogenetic and land use differences (as in observatory pairs such as Narais and Duruchaus) in different biomes along the transect. |
Dominant Crust Type |
well developed cyanobacteria crust with lichens (e.g Psora) and bryophytes (e.g Riccia); hypolithic crust (quartz pebbles) |
Biological Soil Crust Biomass (chlorophyll) |
high |
BSC Biomass ranking (from BSC chlorophyll a+b values [mg/m2] )very low <= 10low = 11 to 50medium = 51 to 100high = 101 to 200very high > 200 |
   |
Main green algae genera |
|
SpongiochlorisNeospongiococcumTetracystisChlamydomonasOocystisTotal Taxa No.: 9 |
Implementation of molecular identification techniques - Cyanobacteria |
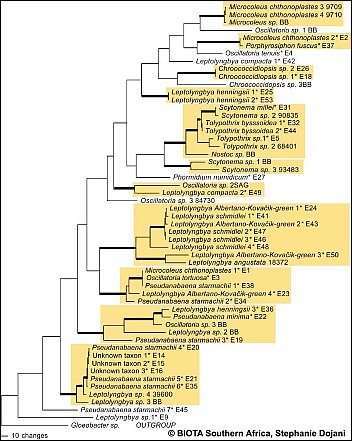 Fig.A: Preliminary results of sequence data is shown in 1 of 6 most parsimonious trees based on 16S rDNA sequences. Asterisks indicate taxa found along the BIOTA South transect.(Please click on map) Fig.A: Preliminary results of sequence data is shown in 1 of 6 most parsimonious trees based on 16S rDNA sequences. Asterisks indicate taxa found along the BIOTA South transect.(Please click on map)
|
The polyphasic approach (morphology and sequence data) is expected to give reliable results in detection of taxa diversity of cyanobacteria. However preliminary results of the molecular analysis of selected cyanobacteria strains (1 of 6 most parsimonious trees based on 16S rDNA sequences) indicate that most of the investigated genera (/Leptolyngbya, Pseudanabaena, Scytonema, Microcoleus/) are polyphyletic. These results are in concordance with findings e.g. by Casamatta et al. 2005. In a second approach, the more variable intertranscribed spacer (ITS) was amplified, which is expected to provide further information on species level.  Casamatta, D.A, Johansen, J.R., Vis, M.L., Broadwater, S.T., 2005,Molecular and morphological characterization of ten polar andnear-polar strains within the oscillatoriales (cyanobacteria)J. Phycol. 41, 421-438. Casamatta, D.A, Johansen, J.R., Vis, M.L., Broadwater, S.T., 2005,Molecular and morphological characterization of ten polar andnear-polar strains within the oscillatoriales (cyanobacteria)J. Phycol. 41, 421-438.
|
Implementation of molecular identification techniques - Green algae |
Regarding the algae in BSCs, a large fraction of the algal community appears to be non-culturable, but contributes considerably to the crust biodiversity. Recent studies demonstrate that the true taxonomic affiliations of microscopic desert green algae can only be established reliably with the aid of DNA sequence data, particularly 18S rDNA data. Thus molecuar techniques are required to complement the cultural approach in order to achieve a more reliable assessment of the biodiversity actually present in BSCs. SSU rRNA gene cloning and sequencing is the best established technique for assessing biodiversity from environmental samples with molecular techniques. A more rapid and easy to use technique is DGGE which in combination with cloning/sequences has been found a very useful method to investigate biodiversity of microalgae in and on rocks.Maximum likelihood phylogenies demonstrating the high phylogenetic diversity of green algae obtained from Biological Crusts of 16 different sampling sites in Southern Africa.A total of 279 green algal sequences were obtained from cultures (204) and clone banks (75). They are distributed on many independent lineages and clades comprising the green algal classes Chlorophyceae (Fig. B; 206 sequences) and Trebouxiophyceae (Fig. C; 73 sequences). Colour-coding is used to show the various origins of the groups of green algae. The origin of strains/clones is given in boxes with the number of studied strains/clones per locality. So far, in most cases only a rough genus assigment is possible and several yet unidentified lineages/clades may represent new genera and/or species. Green algae from the "cf. Deasonia", "Scenedesmus deserticola" clades and from a still unidentified chlorophyceaen clade are among the most frequently occuring algal species. There is a general trend with carotenoid-accumulating members of the Chlorophyceae being more abundant than non-carotenoid accumulating Trebouxiophyceae.The phylogenies were obtained from the ARB SSU rDNA sequence database in which partial sequences (350-800 nts in length) from Biological Crust Green Algae were compared with corresponding full-length green algal sequences public databases and unpublished sources using a 50% position conservation filter. Groups of sequences with similarities among each other of 99% and above were collapsed into one triangle. Scale, 10% estimated genetic difference. |
") Fig. B: green algal sequences for class Chlorophyceae (206 sequences) (Please click on map) Fig. B: green algal sequences for class Chlorophyceae (206 sequences) (Please click on map)
|
") Fig.C: green algal sequences for class Trebouxiophyceae (73 sequences) (Please click on map) Fig.C: green algal sequences for class Trebouxiophyceae (73 sequences) (Please click on map)
|
Related Map(s) |
  |
Please click on map(s) |
Development and implementation of remote sensing techniques for long-term monitoring of BSCs |
In the Succulent Karoo, Biological Soil Crusts (BSCs) form a major component of the standing vegetation, reaching biomass values over 100 mg Chl a+b m2. We found a high diversity of organisms and crust types at different successional stages, showing characteristic distribution patterns with respect to various biotic and abiotic factors. In order to map the BSC distribution patterns we obtained hyperspectral images (CASI and SASI sensor, Fig. 1) at a spatial resolution of 1 m, covering an area of 2 x 6 km (including the observatory Quaggasfontein).Together with ground truthing and spectroscopy data (Fig. 2) we developed a methodology to classify the Biological Soil Crusts in the hyperspectral image. This resulted in a map of Biological Soil Crusts in the Succulent Karoo (Fig. 3, only subset shown), where over 10% of the area was classified as BSCs (shown in yellow). In areas without roads and inselbergs BSC coverage reached almost 20%. The actual coverage is expected to be even higher, since BSCs under shrubs cannot be detected. The mapping results will be used as baseline for the BSC monitoring project. |
Functional ecology of BSCs and their influence on nutrient cycling |
For four different crust types (cyanobacteria dominated BSC, BSC with cyanobacteria and mosses, moss dominated BSC and lichen dominated BSC) gas exchange was measured with a cuvette (Fig. 4) to determine the C-fixiation rate of soil crusts. Gas exchange of the crusts was measured after a rain shower. As an example, the gas exchange rate of the moos dominated crust was clearly inhibited at the beginning in the morning (Fig. 5). Around 11:30 the optimum is reached, afterwards it decreases and reaches negative values at 3 p.m. for a short time period before approaching the zero point. The examination of the crust in dependence of the fictitious water column (Fig. 6) shows that the netto photosynthesis of the crust is depressed at 2 and more mm water column, since gas exchange is inhibited. The optimum netto photosynthesis is reached at 1,5 mm water column whereas below that dehydration takes place. |
Microclimate and weather as ecological regulators of BSCs |
Since October 2004, meso- and microclimatic parameters are recorded on a bihourly basis in the Succulent Karoo close to the observatory 22 Quaggafontein (Fig. 7, 8). Mesoclimatic parameters measured are: air humidity, air temperature, light (PAR), amount of rain and occurence of dew. To analyse the microclimatic conditions in their relevance for BSC establishment, the microclimatic sensors were installed at sites with and without biological crusts and comprise soil temperature and soil humidity sensors at different depth as well as temperature sensors under a quartz pebble and in a dwarf shrub. First resultes are outlined for observatory Flaminkvlakte. |
|
|
|


 "Green algal sequences for class Chlorophyceae (206 sequences)")
 "Green algal sequences for class Trebouxiophyceae (73 sequences)")


